Metric
Description
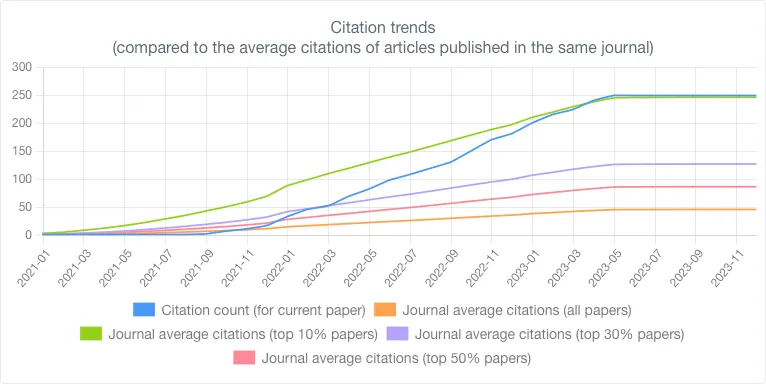
This metric illustrates the citation count over time (represented by the blue line in the graph) in comparison to the average citation count for the journal where the paper was published.
Through this, one can discern approximately what percentage of citations this paper holds within
the same journal, providing insights into its relative prominence.
Additionally, it enables an assessment of the paper's impact within the journal, reflecting the extent of its influence on research within that specific scholarly community.
Where can I find it?
•
The Paper page.